Improve troubleshooting experience | AWS
Improve CloudWatch Troubleshooting experience
I joined Amazon CloudWatch as one of the senior designers, tasked with the mission of redefining the entire Monitoring and Troubleshooting Experience.
CloudWatch itself is a monitoring, analytics and data visualisation platform for software developers to monitor their applications – and also for management to monitor trends and costs and shape their business strategy.
CloudWatch runs one of the largest data stores on the planet, and we are solving problems of massive scale. AWS CloudWatch is used by leading businesses like Netflix, LinkedIn, Facebook, WarnerMedia, BBC, Adobe, Twitter etc.
We have 3 million weekly active accounts – the scale is very big.
I was brought into the team to focus on multiple retention, activation and acquisition metrics. How could we improve a product for engineers that would make them want to use Amazon CloudWatch for Monitoring and Troubleshooting instead of other competitors? I introduced various creative solutions. I pushed our team to prioritise metrics and to understand what a ‘golden path’ might be for our customers.
Align on KPIs
1. I ran a workshop to align existing resources and KPIs between the product team and UX team at the start of the project.
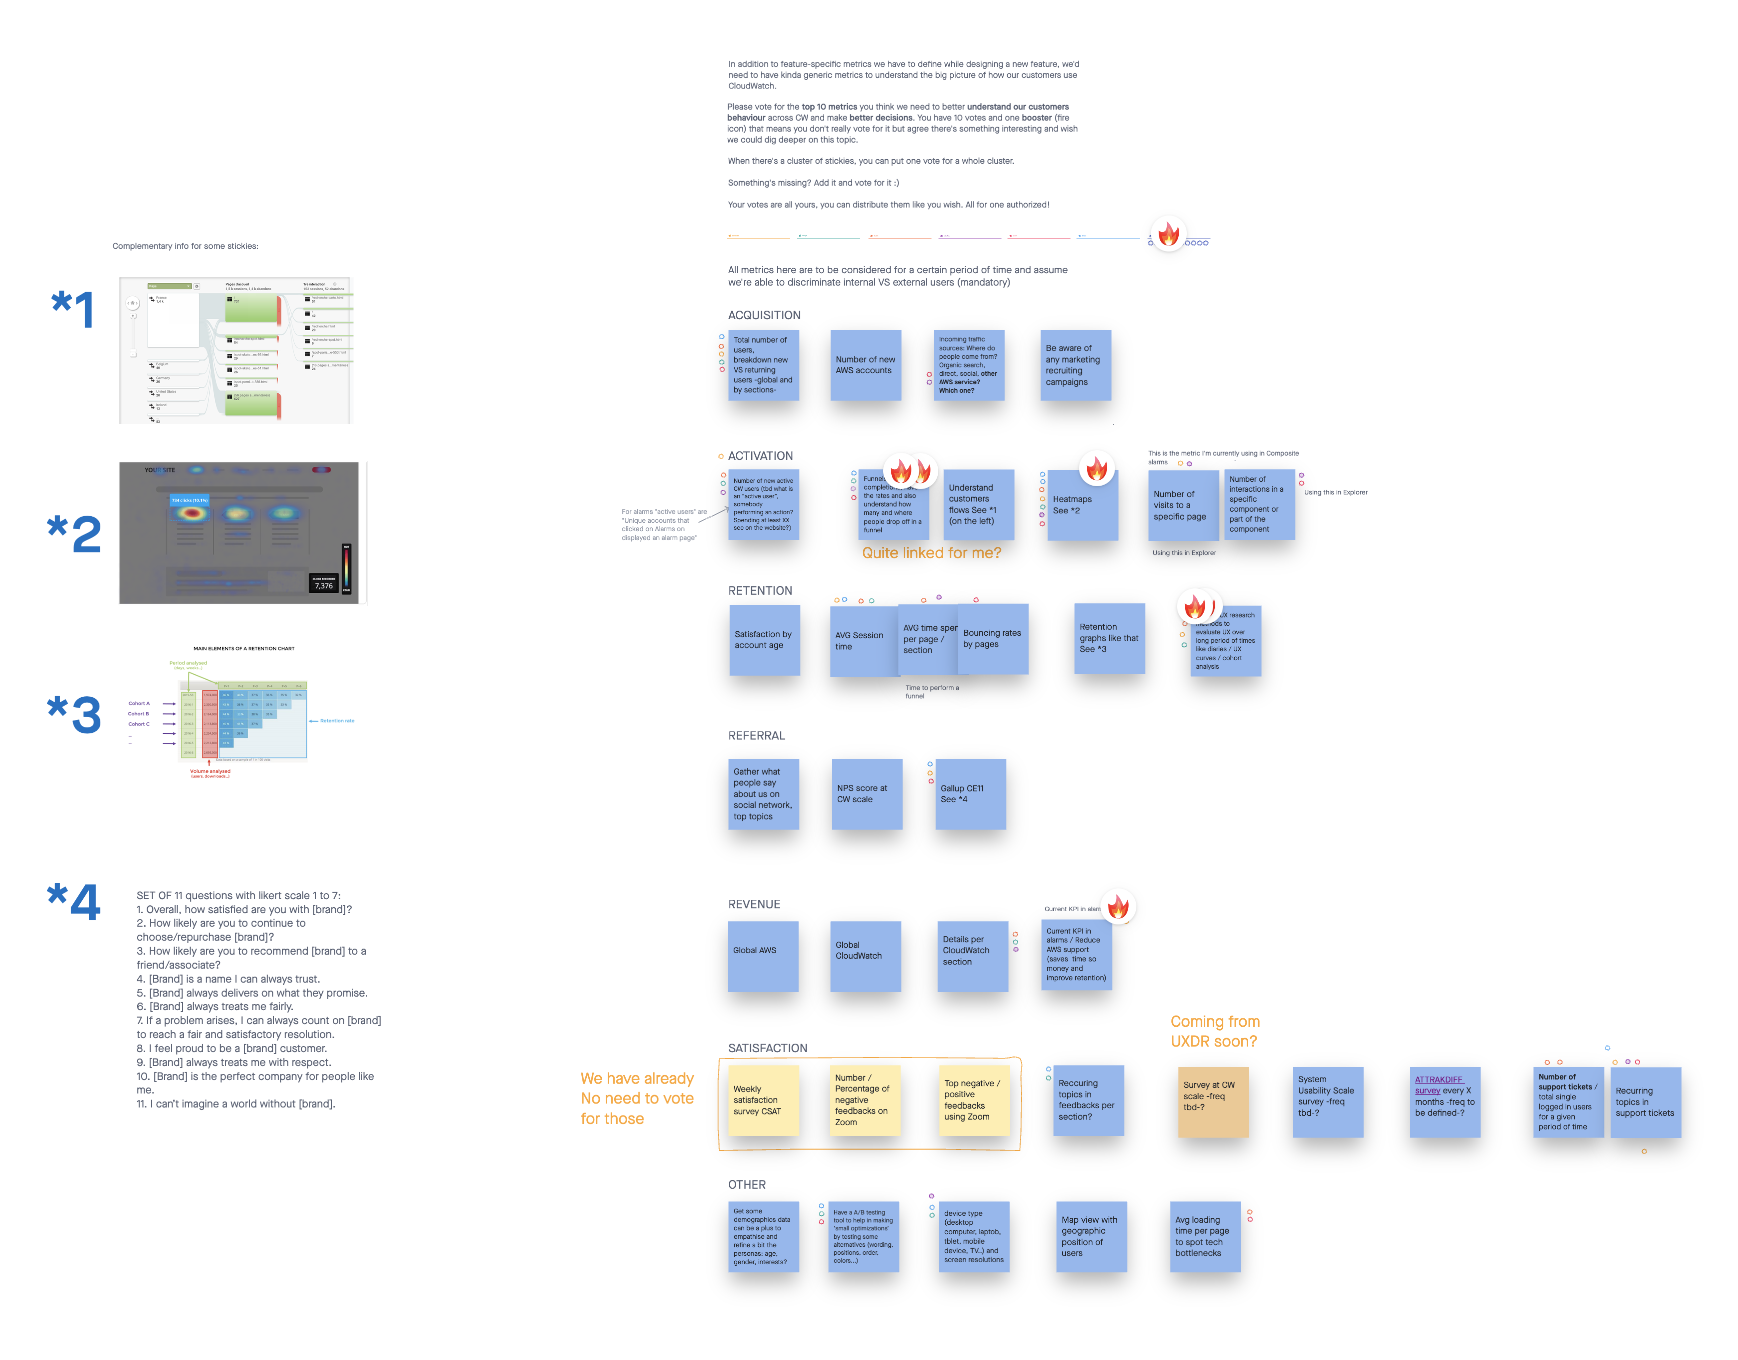
We focussed on these metrics
Activation and engagements:
- Number of created dashboards.
- Number of created alarms.
- Funnels completions rate.
- Average time spent to close a ticket.
- Average time spent in the platform per user.
Acquisition:
- Number of new AWS accounts
- Incoming traffic sources
Research studies
2. I defined CloudWatch archetypes, mapped user journeys, validated creative proposals with customers and stakeholders, and defined the MVP.
Troubleshooting Archetypes

Engineer journey – Start from Onboarding CloudWatch to the root cause solution
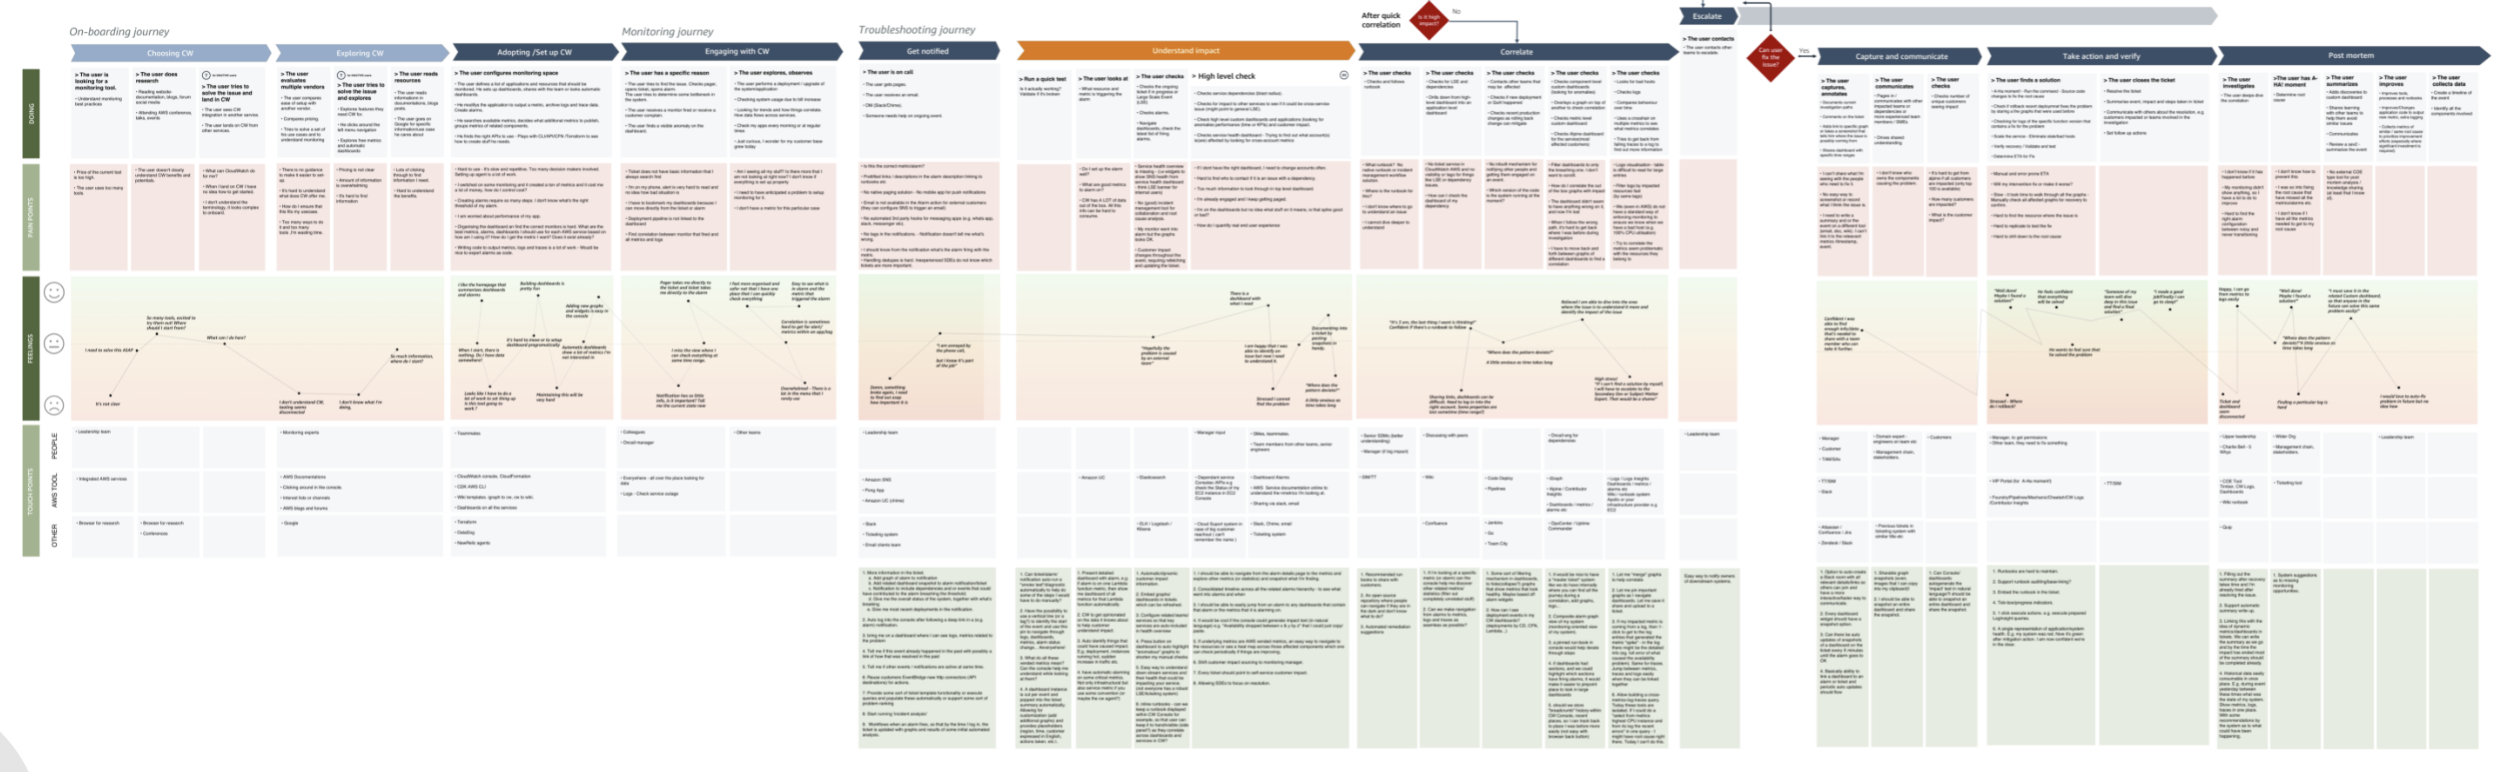
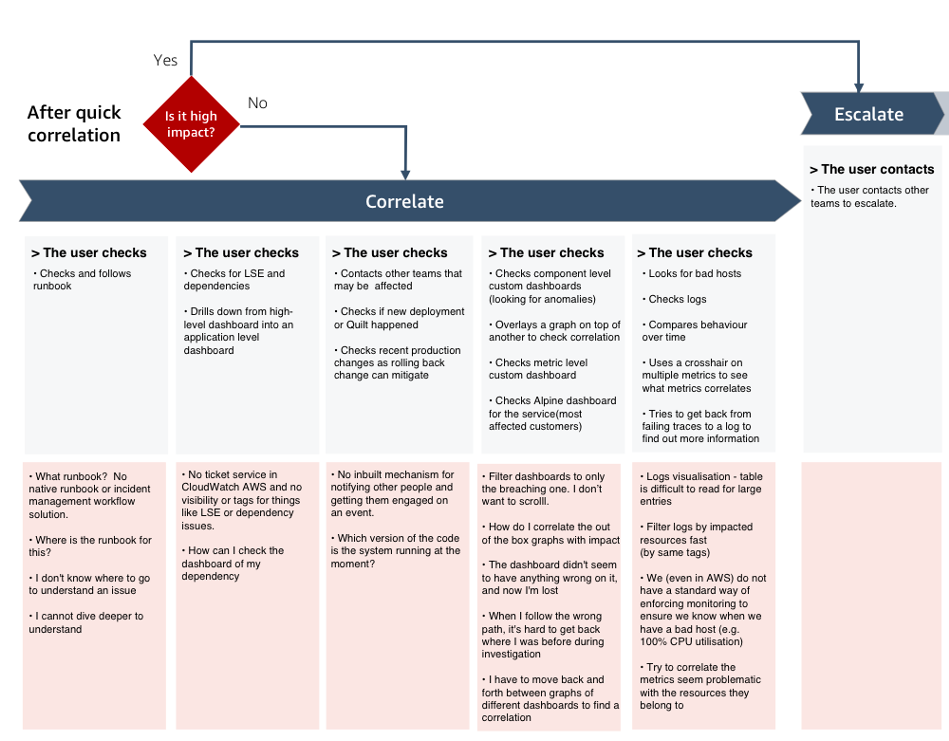
3. Voted for the most critical part of the journey
We assumed that improving correlation and root causing, were the most critical step for our customers
4. Analysed existing data
I analysed heat-maps and data funnels to understand existing customers behaviour.
- 42% leave to other AWS services to check dependencies.
- 14% leave check recent production deployment.
- 20% leave to understand correlating data on other dashboards.
5. Shared main insights and pain points
Customers need to find relevant data quickly, they need to be able to correlate, analyse, and compare data points. CloudWatch currently offers a fragmented experience. Customers today jump between services, regions and applications, losing their context and slowing down their root analysis.
Ideation
7. Conducted a design studio workshop
Converged 3 ideation workshops and ran a series of experiments designed to find metrics that defined user retention, acquisition and activation.
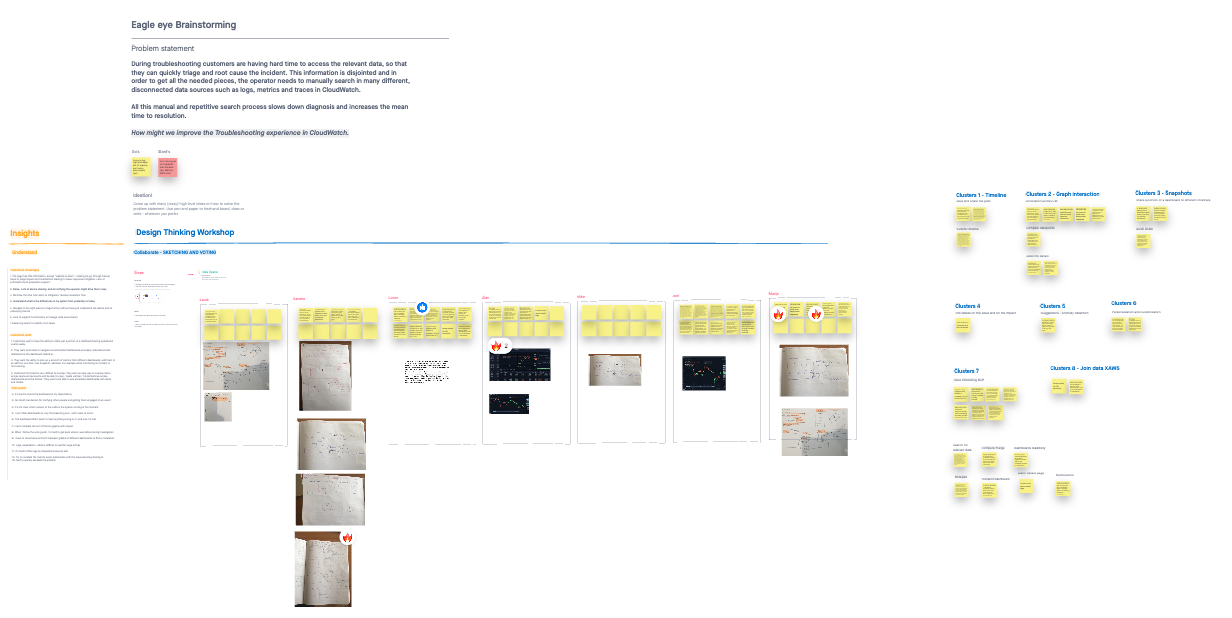
MVP scope
8. I proposed a list of new features to ensure full stack observability – one place to find everything. I improved existing flows, interactions and data correlation patterns.
Solving correlation with the Investigation Panel
- Show correlated data in context.
- Link to related dashboards and runbooks.
- Provide a place to report correlation.
- Save screenshots during investigation.
- Copy and share annotation.
Solving comparison with additional functionality:
- Compare dashboards functionality.
- Merge graph functionality.
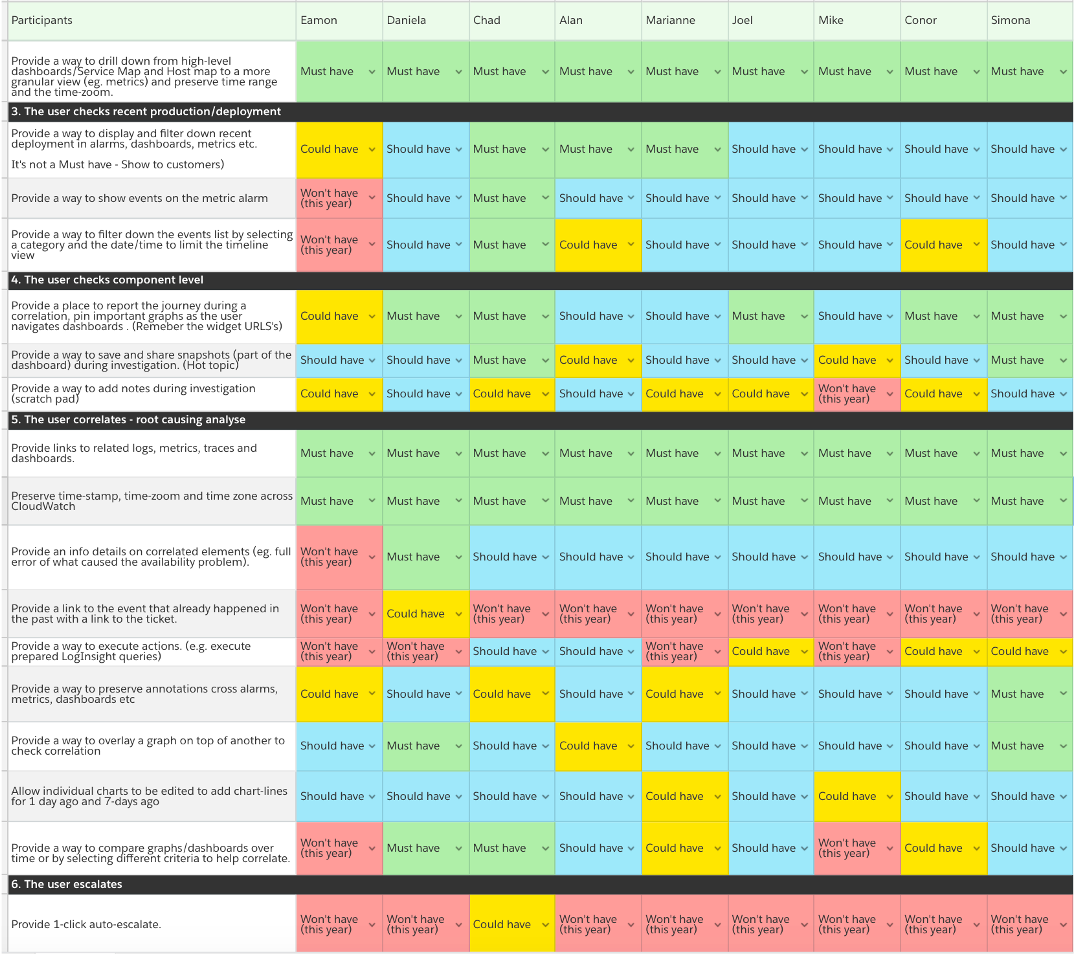
9. We prioritized a list of possible features. The prioritization was based on:
- Focus groups polls result.
- Feedback channel analysis.
- Most critical usability issues.
- Blocker for adoption.
- Number of users effected.
- Engineers effort.
10. I validated the product solutions and conducted user testing
Counting 3 iterations from concept design prototype to high fidelity prototype.
11. I tested and iterated high-fidelity prototypes, and A/B test small improvements, supporting developers to guarantee the best quality.
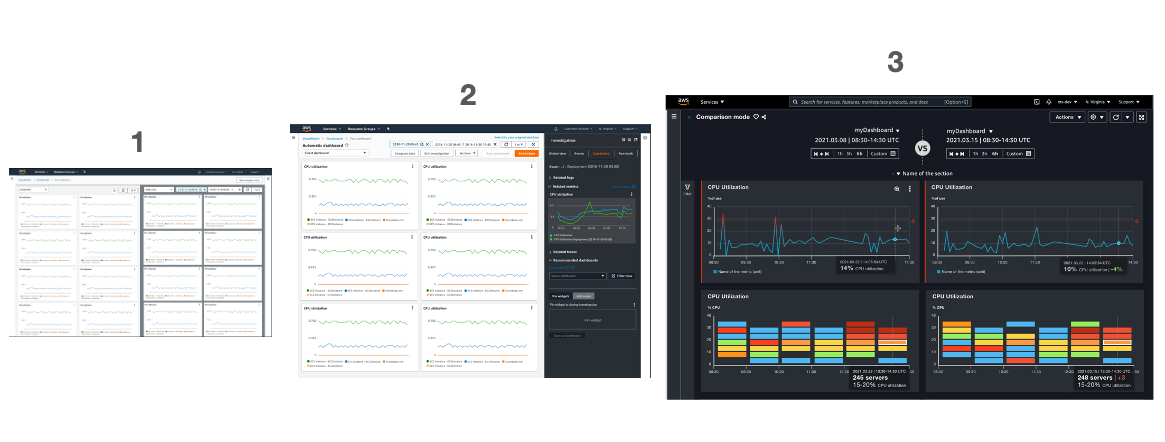
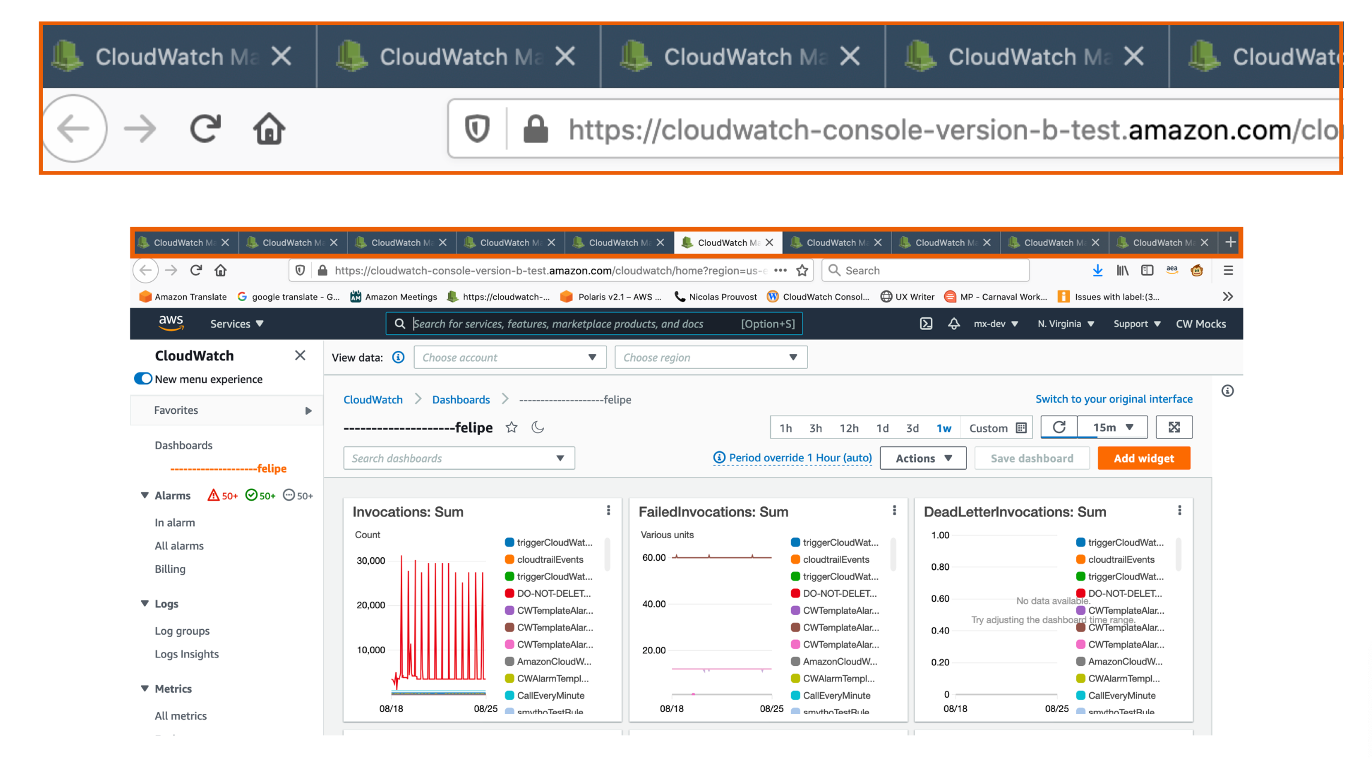
Comparing / Before
Before customers used multiple open tabs, browser windows side by side, and took screenshots to compare regions, environments or time windows.
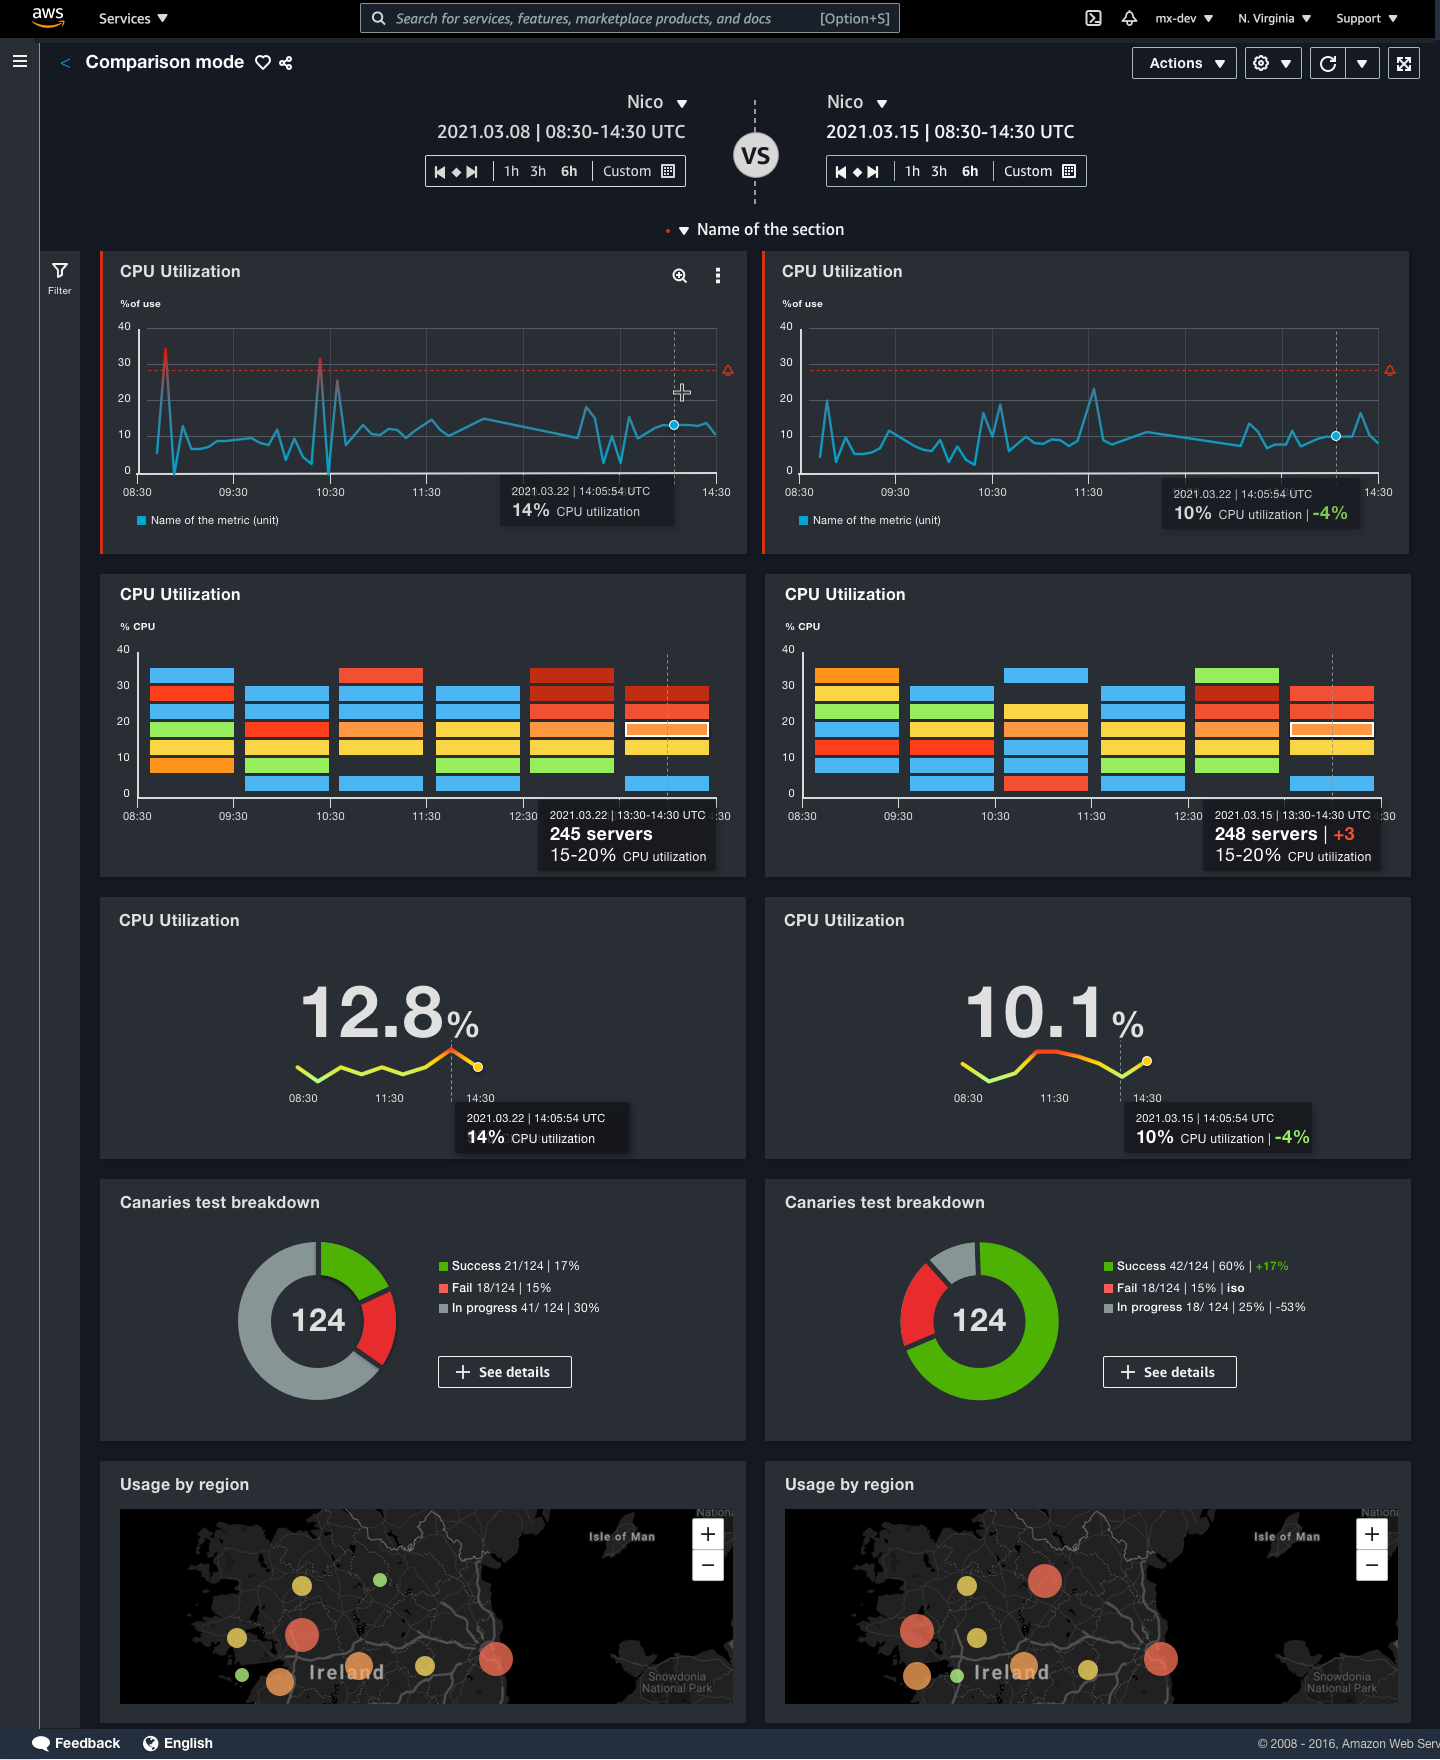
Comparing | After
Split views in one tab, side by side, independent time range.
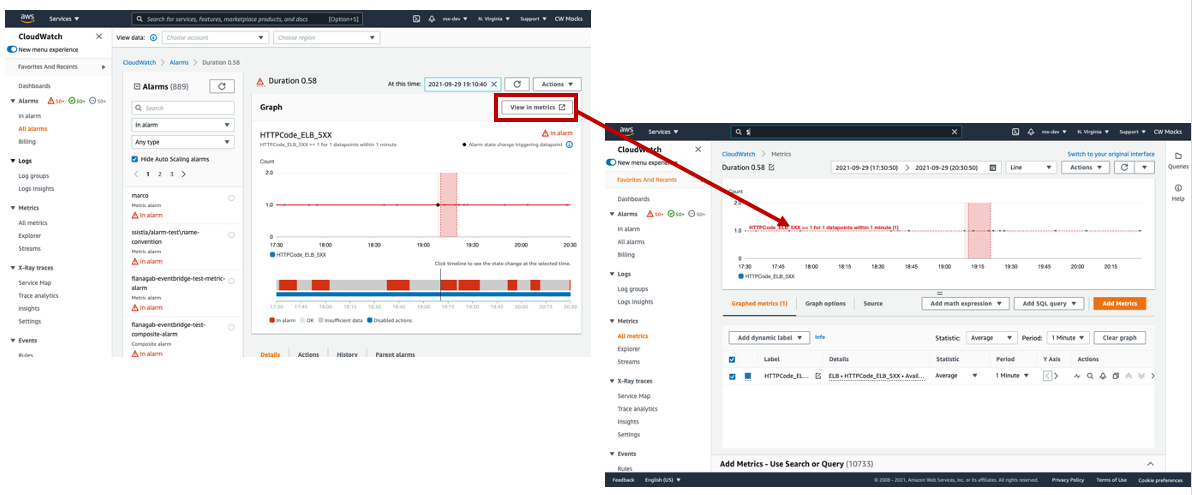
Correlation | Before
To see correlated metrics, customers are clicking the “View Metrics” button.
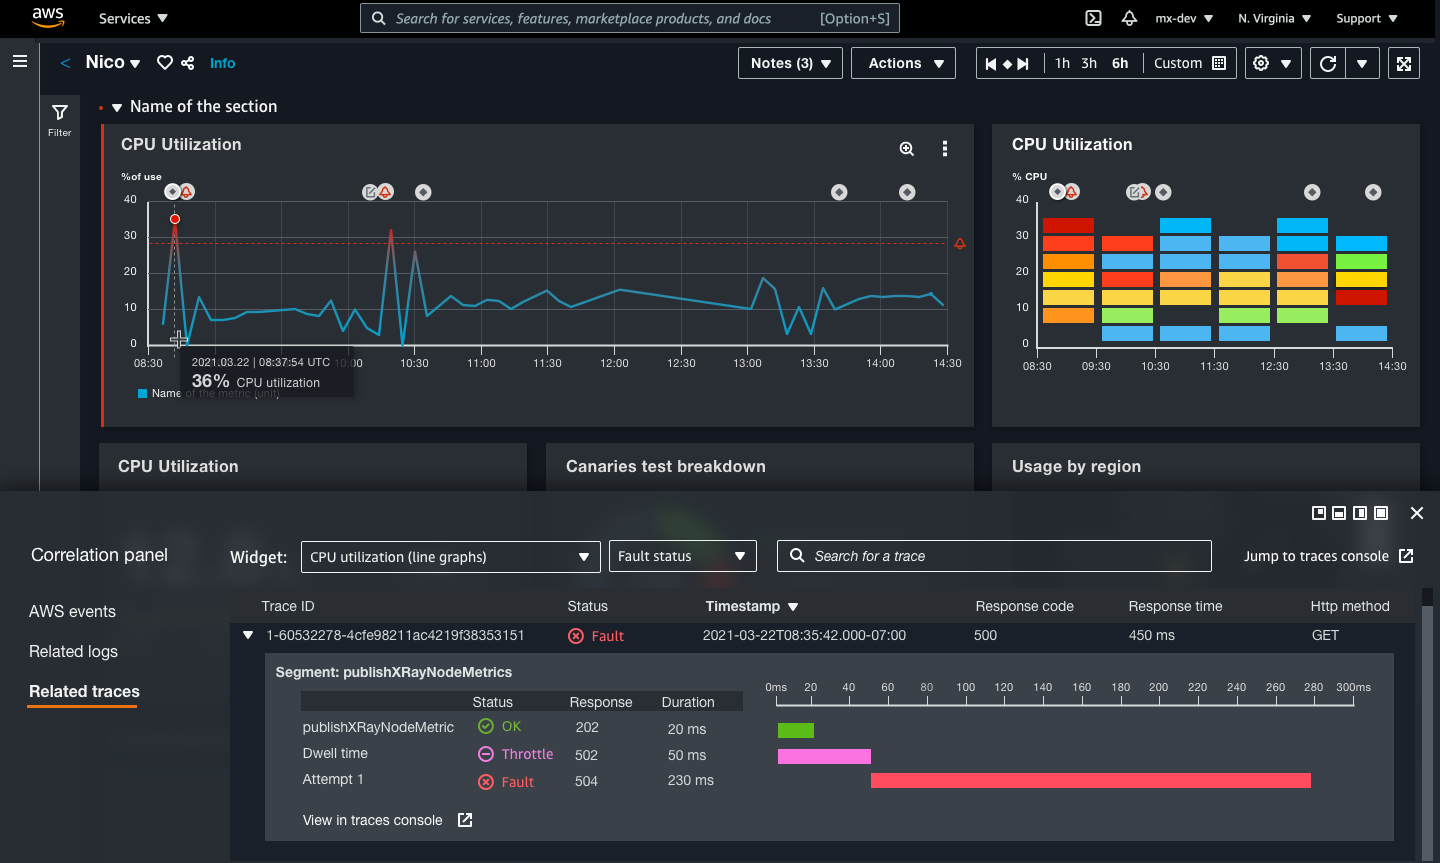
Correlation | After
Customers can see correlated data in the bottom split view, preserving the same time range and time zone.
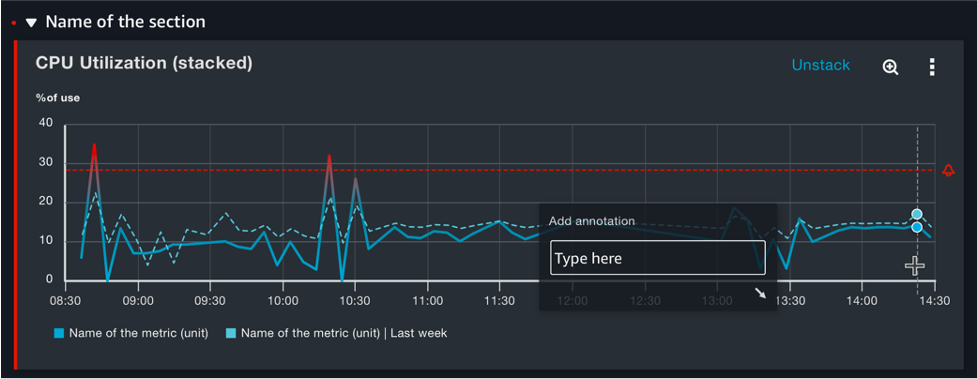
Annotation | Before
Customers needed to select a specific metric and the related graph option tab to add annotations.
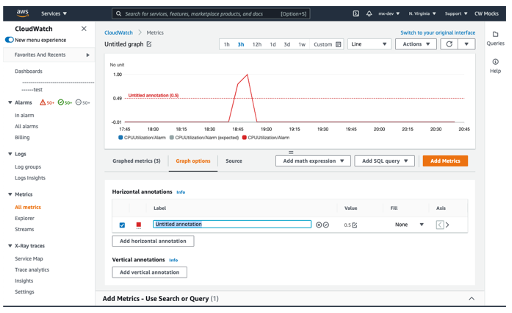
Annotation | After
Customers can add annotation straight on the graph by right clicking.
12. Experimentation and measurement
I analysed feedback after launching the beta version to a group of selected customers, and tracked metrics on the live platform.
3 weeks after launch, we calculated we. had 20,000 new dashboards and 2,000+ new alarm aggregations. We reduced the drop-off to 11% with an increase in positive feedback of 7%.
At the end of the quarter, I put together a data report to communicate the next steps and share the new proposal.
Peer and Manager quotes
“Simona is always willing to improve CloudWatch to satisfy customers. She dives deep to understand customers’ behaviors and provides insightful research reports to backup her decisions. I was very impressed by her alarms research and metrics rework. I like her curious mind and, for example, all the inspiring stuff she shared with us about data visualization.”
— Engineering Manager
“Simona is a real voice of the customer. Her decisions are based on research insights, data and customer feedback. She is always driving the teams to deliver high quality results, while both managing the projects and staying connected to details”
— Sr. Product Manager
“Simona is a true advocate for Customer Obsession, putting the needs of the customer first with excellent communication to develop her point. This can often be difficult with the level of complexity with certain products, which she takes in her stride. She is always open to feedback and I’m excited to see her impact/contribution to the entire Console going forward”
— UX Manager